Artists Graphs - not so complicated.
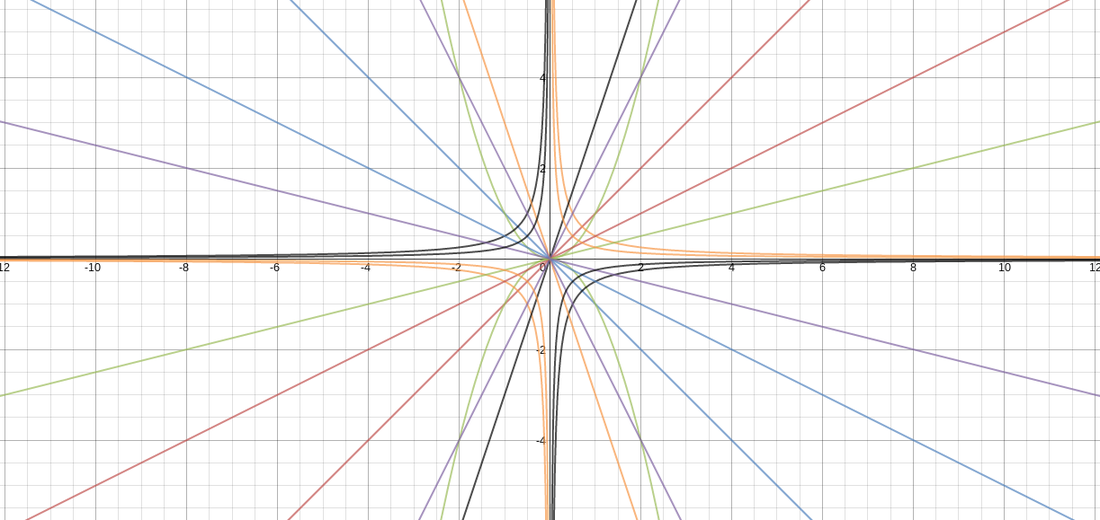
This is the first assignment of PreCalculus! We made art out of a graphing calculator on the computer called Desmos. In this amazing art work of mine, I created reciprocal equations with different amounts to change the spacing as well as reverse reciprocal equations to counter the others to create a visually pleasing diamond in the center. I also created many simple linear lines to create the diagonal shapes in the picture. The inclusion of quadratic equations was a nice touch as well but I wish I would have included some horizontal quadratics as well the two vertical ones. (Families of Functions)
Piecewise Functions
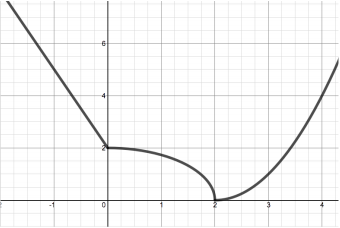
This is project that the class did together on the projector screen. We learned how to combine a linear function, square root function, and quadratic function (parabula).
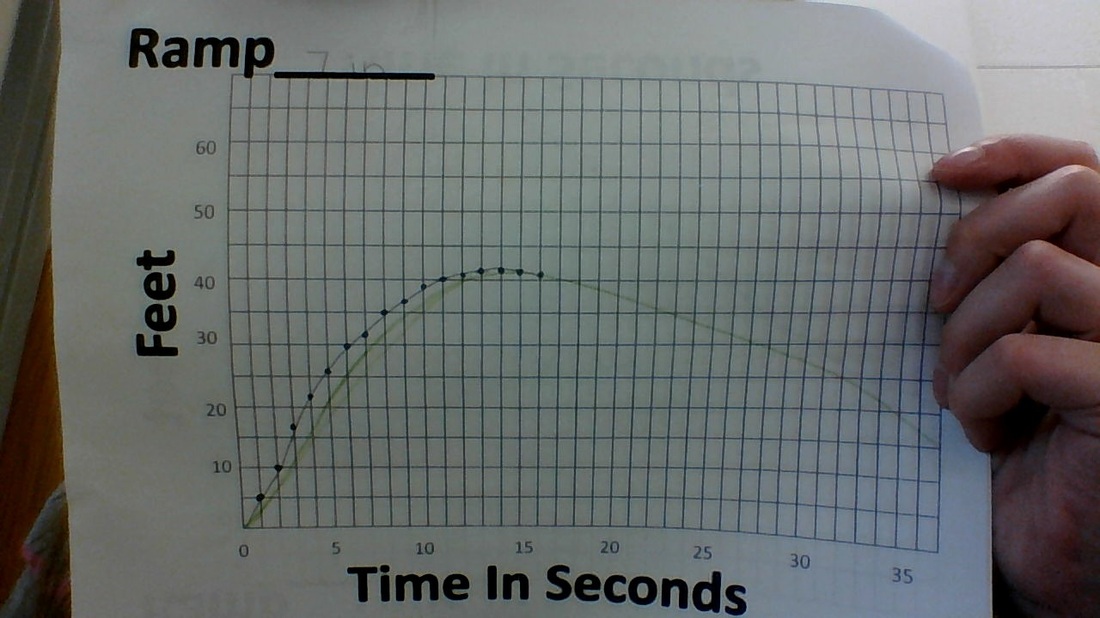
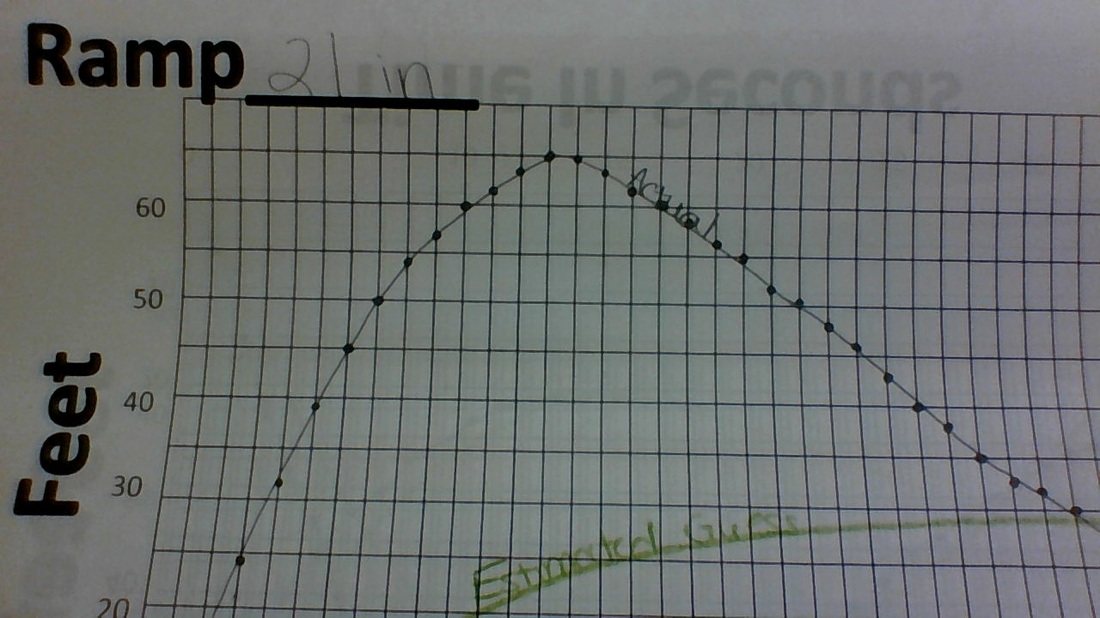
Graphs on Estimated FAILURE and Accurate Measure!
|
|
This is the Third, or fourth, project of Pre-Calc! Fifth hour was made to watch a somewhat creepy, yet hilarious, video of Mr. Kelly and his fellow teacher slide a skateboard down a 21 in, 14 in, and 7 in ramps. After each individual watched the video in a whole and recorded their estimated guess in colored pencil, we then had to watch them in slow motion, stopping them every second, to record the actual distance-time ratio in regular pencil. As you can clearly see, I was a failed attempt and I was not able to make a close estimated guess on any of the graphs. My first one to the far right was a mistake because I did not watch the video beforehand. (Skateboard)
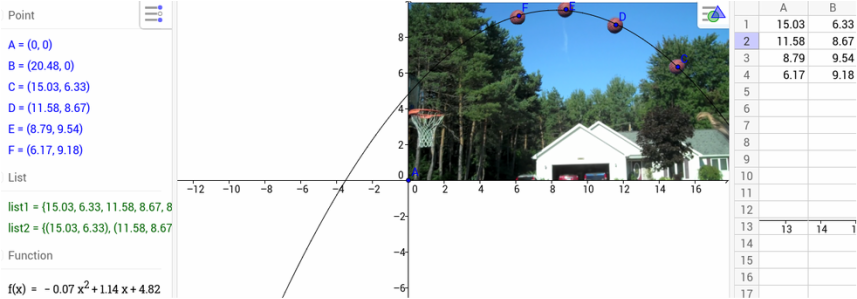
Basketballs
|
I don't think that the basketball will make it into the hoop because the graph that was made by the points is not predicting that it will go in. However, it is possible that the basketball will bounce off the backboard and make it in to hoop.
|
Reflections
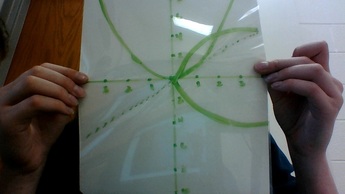
The inverse of the parabula function y=x^2 is the square root of x. However, this can be positive or negative. Even though my drawing was completely amazing, it still didn't quite match up after I folded it along the y=x symmetrical line. This may be because I made it so the x-axis goes by ones and the y-axis goes by twos.
Connecting ZEROS and Factors
1) The connection between zeros and factors is that they are basically the same.
Limits!!!
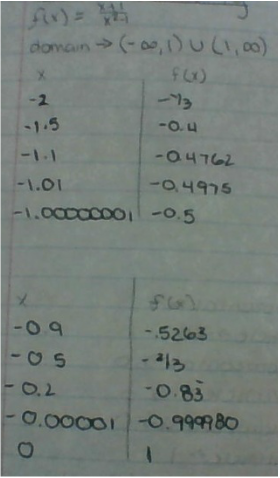
1) Limits are basically asymptotes that you can get closer and closer to, but never touch with going on for infinity.
2) You can tell that a limit exists when there is an equation that is a fraction. The limit is when that denominator equals zero. This is the same process to find asymptotes.
3) Limits helps us explain function behaviors at points of discontinuity to help us determine when graphs will stop and start again.
Folding to the Moon
It would take 42 folds to get to the moon. This is unrealistic because it is difficult to fold an 8' by 11' six times, let alone 42. you would need a ridiculously large piece of paper to be able to fold it easily. The stack would end up being not so wide if the paper has to span for miles to reach outside of the Earth's atmosphere. It would have to be very tall to reach, but the thicker the paper gets, the less wide it would be to make it higher. The wideness would not necessarily matter as long as the thickness would span the length to the moon.
College Loan
If I spent five thousand dollars every year in college for a four year degree, with a 4.66% interest rate paid over 10 years
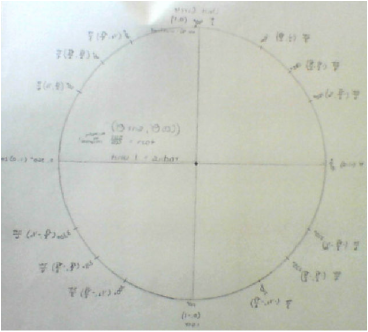
Unit Circle!!!
|
How to use the unit circle! (using a radius of one)
Take a 45 - 45 - 90 triangle to make the 45 degree angles between the quadrants. The 45 degree angles are always (square root of two/two, square root of two/two) and are always something pie/four. Take a 30 - 60 - 90 triangle to make the 30 and 60 degree angles in each quadrant. Every 30 degree angle is (square root of three/two, one half) and are always something pie/six. Every 60 degree angle is (one half/square root of three) and is always something pie/three. 360 degrees is two pie and 180 is pie. 90 degrees is pie/two and 270 degrees is two pie/three. find sin and cosine - (cos O, sin O) x and y coordinates.! Tangent is sin/cos (multiply by reciprocal if square root is on bottom!) tan 90 = undefined |
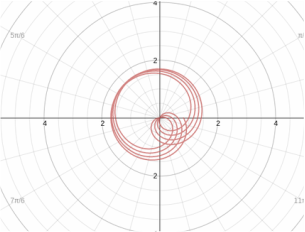
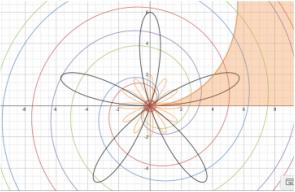
Polar Graphing
|
This was a project that our class did in Desmos. We learned how to create interesting circle graphs and make roses out of two different equations. When r= any number, then it will create a circle along that line and the diameter size will change depending in the direction of change. Then, we went on to using the equation r=sin(theta). If you changes the coefficient in front of sin, then you would change to size smaller or larger depending on the direction of change. If there was a coefficient in front of the theta inside the parenthesis, then it would change the circle into petals. An odd number would create the exact amount of petals (five=five petals), if the coefficient was even then it will create double petals (four=eight petals). In order to create a spiral effect, we set r directly equal to theta. In order to create the shaded region, we made the equation r > theta. It was amazing and fun to see the changing sizes and petal numbers at once with sliders.
|
|
